Shelter Seeking

Distance to Nearest Shelter

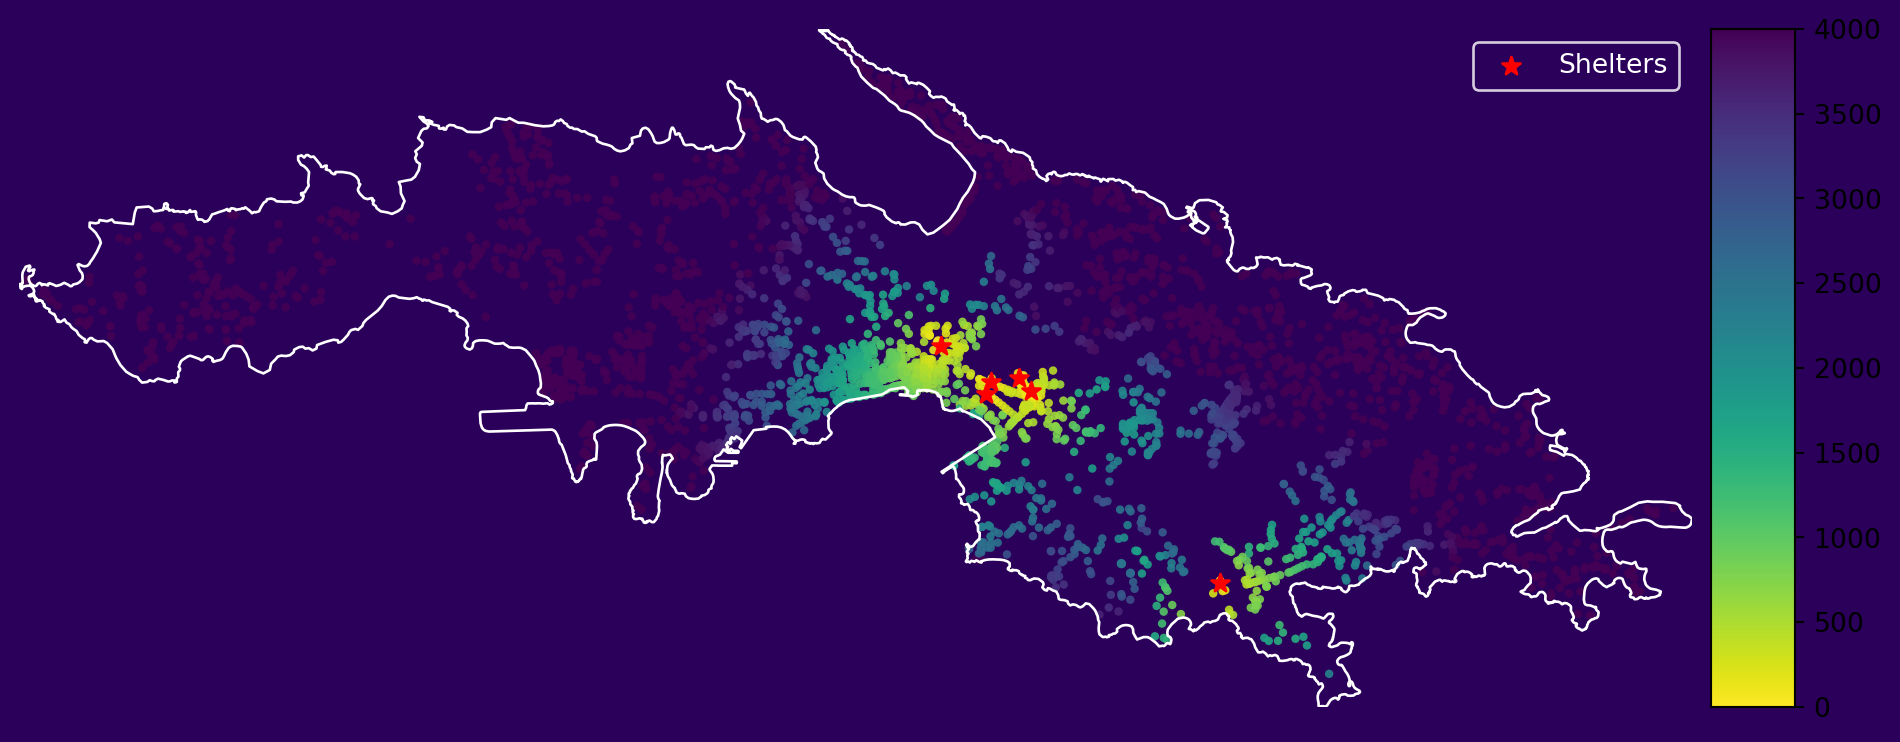
A walkable network was built with Pandana by projecting OSM street nodes/edges to the project CRS, marking shelter POIs, and running Pandana shortest-path queries to compute walking distance from each network node to its nearest shelter. These node-level distances were mapped back to buildings via the nearest network node, producing a per-building “walking distance to nearest shelter” attribute, and a Pandana heatmap visualizes shelter accessibility across the island.

The walking-distance map shows clear spatial gradients: central shelters are concentrated on the south side of St. Thomas, where nearby buildings have the shortest distances (tens to a few hundred meters), while peripheral areas exceed roughly 2000–3500 m, highlighting accessibility gaps where adding shelter capacity or improving pedestrian connectivity would most reduce isolation.

Code
import matplotlib.pyplot as plt
from mpl_toolkits.axes_grid1 import make_axes_locatable
import geopandas as gpd

# Align CRS
boundary_3857 = boundary.to_crs(target_crs)
shelters_3857 = shelters.to_crs(target_crs).copy()

# Fix boundary and build a union
boundary_union = boundary_3857.buffer(0).unary_union

# Clip nodes to boundary
nodes_clipped = nodes_gdf_3857[
    nodes_gdf_3857.geometry.within(boundary_union)
].copy()

def plot_walking_distance_to_shelter(
    nodes_gdf_3857,
    shelters_3857,
    column="dist_to_shelter_m",
    title="Walking Distance to Nearest Shelter"
):
    fig, ax = plt.subplots(figsize=(10, 4))
    divider = make_axes_locatable(ax)
    cax = divider.append_axes("right", size="5%", pad=0.1)

    # Plot clipped nodes colored by walking distance
    plot_kwargs = {"s": 10, "alpha": 0.9, "cmap": "viridis_r", "edgecolor": "none"}
    scatter = nodes_gdf_3857.plot(
        ax=ax,
        cax=cax,
        column=column,
        legend=True,
        **plot_kwargs
    )

    # Add shelters as red stars
    shelters_3857.plot(ax=ax, color="red", markersize=50, marker="*", label="Shelters")

    # Add boundary
    boundary_3857.boundary.plot(ax=ax, edgecolor="white", linewidth=1)

    # Formatting
    fig.patch.set_facecolor("#2b005a")
    ax.set_facecolor("#2b005a")
    xmin, ymin, xmax, ymax = boundary_3857.total_bounds
    ax.set_xlim(xmin, xmax)
    ax.set_ylim(ymin, ymax)
    ax.set_axis_off()

    # Legend styling
    leg = ax.legend()
    if leg:
        for txt in leg.get_texts():
            txt.set_color("white")
        leg.get_frame().set_facecolor("#2b005a")
        leg.get_frame().set_edgecolor("white")

    plt.tight_layout()
    return ax

# Example usage:
ax = plot_walking_distance_to_shelter(
    nodes_gdf_3857=nodes_clipped,
    shelters_3857=shelters_3857,
    column="dist_to_shelter_m"
)
plt.show()

Figure 3: Distance to Nearest Shelter

Figure 3: Distance to Nearest Shelter